¶ The Machine Learning Results Page Explained
This page is the dashboard for VADRR's screening model. It shows how confident the model is about the
citations you haven't screened yet, how well it's performing, and signals that help you decide
when it's safe to stop screening. Open it from Abstract Screenings ▸ Machine Learning Results
(Leaders only).
First, read How machine-learning screening works for the
background. This page assumes a model has been trained.
The Machine learning results page has several components. We walk through them one by one below.
¶ Header Metrics
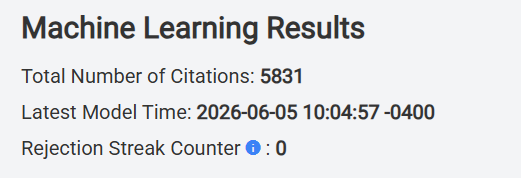
The top of the page contains a number of metrics:
- Total Number of Citations — how many citations are in the project.
- Latest Model Time — when the current model was trained. Predictions reflect your labels as of
this time; newer labels are incorporated at the next training run. - Rejection Streak Counter — see below.
¶ Estimated Coverage Graph
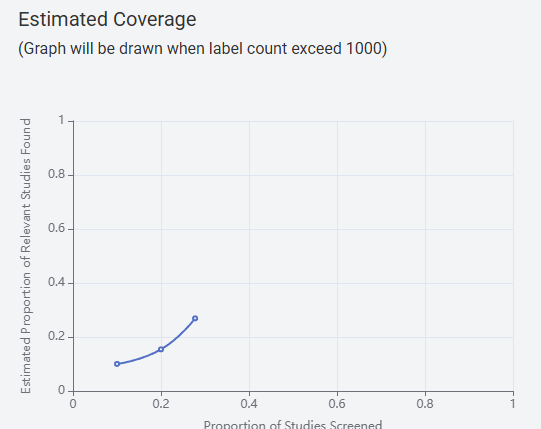
A line chart that estimates your recall — the share of all relevant studies you've found so far.
- X-axis: Proportion of Studies Screened (0 → 1).
- Y-axis: Estimated Proportion of Relevant Studies Found (0 → 1).
How it's estimated. VADRR can't know the true number of relevant studies, so it infers it: it
looks at how densely relevant citations are still appearing in the most recently screened
segment. If you're still finding lots of relevant studies, many probably remain, so estimated
coverage stays low; once recent screening turns up few new relevant studies, the estimate of the
total stops growing and your coverage climbs toward 1. A curve that flattens near the top is a
strong sign you've found almost everything relevant.
The graph is only drawn once the project has 1,000+ labels — below that there isn't enough signal to estimate coverage, and you'll see "(Graph will be drawn when label count exceed 1000)".
¶ Unscreened Citation Predictions
This section is all about the citations the model has scored but no one has screened yet.
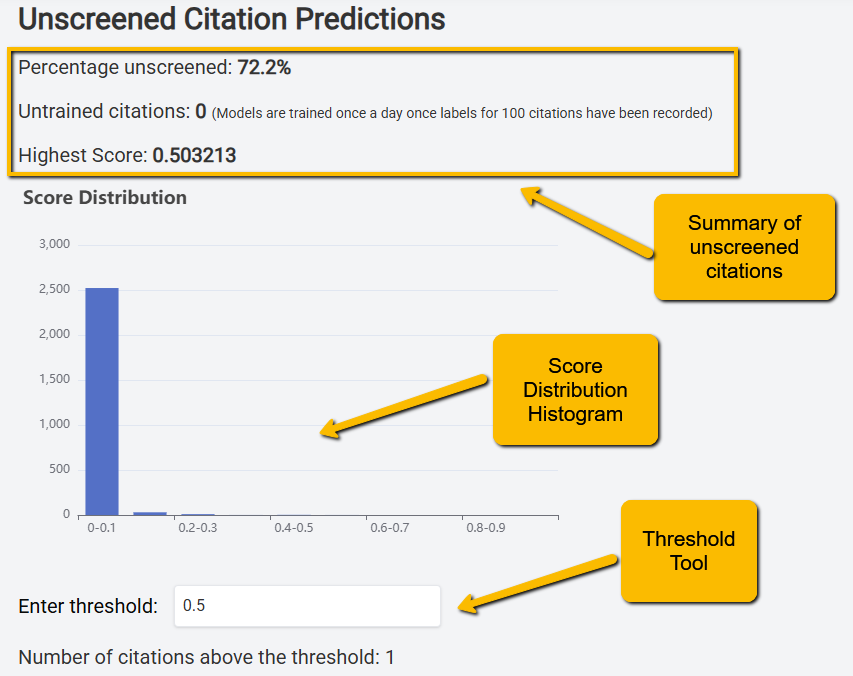
- Percentage unscreened — what share of the pool is still unscreened.
- Untrained citations — labeled citations screened since the latest model was trained, so their decisions haven't been folded into the model yet. (As the in-app note says, "Models are trained once a day once labels for 100 citations have been recorded" — your newest labels are picked up at the next training run.)
- Highest Score — the top relevance score among unscreened citations.
¶ Score Distribution Histogram
A bar chart of unscreened citations bucketed into ten score bins (0-0.1, 0.1-0.2, … 0.9-1, as
labeled on the chart's x-axis).
- The height of each bar is how many unscreened citations fall in that score range.
- A typical, healthy distribution is heavily skewed toward 0 (most remaining citations are
probably irrelevant) with a small bump near 1 (a handful still look relevant). When almost
everything left sits in the lowest bins, you're likely near the end.
¶ Threshold Tool
Type a number into Enter threshold and VADRR shows "Number of citations above the threshold" —
how many unscreened citations score at or above that value. Use it to answer "how many promising
citations are left?": e.g. set 0.5 to count the citations the model would call likely-relevant.
¶ Top 20 Unscreened Citations
The 20 highest-scoring unscreened citations, so you can act on the best candidates immediately:
| Column | Meaning |
|---|---|
| Accession No. | e.g. the PubMed ID |
| Authors | author list |
| Title | citation title |
| Pub Date | publication year |
| Score | model relevance score (0–1) |
For each row:
- See Details expands the full citation record in place.
- Label opens quick Accept / Reject buttons. Choosing one records a privileged
screening qualification that overrides the model, removes the citation from the queue, and is
fed back into the next training run. (It's the fast way to clear obvious decisions without entering
the full screening view.)
¶ 2×2 Confusion Matrix
Click Toggle Confusion Matrix to reveal the model's report card. The matrix compares the model's
predictions against the real labels on the held-out evaluation set, using a fixed cut-off of
0.5 (score ≥ 0.5 ⇒ "Predicted Accept", otherwise "Predicted Reject").
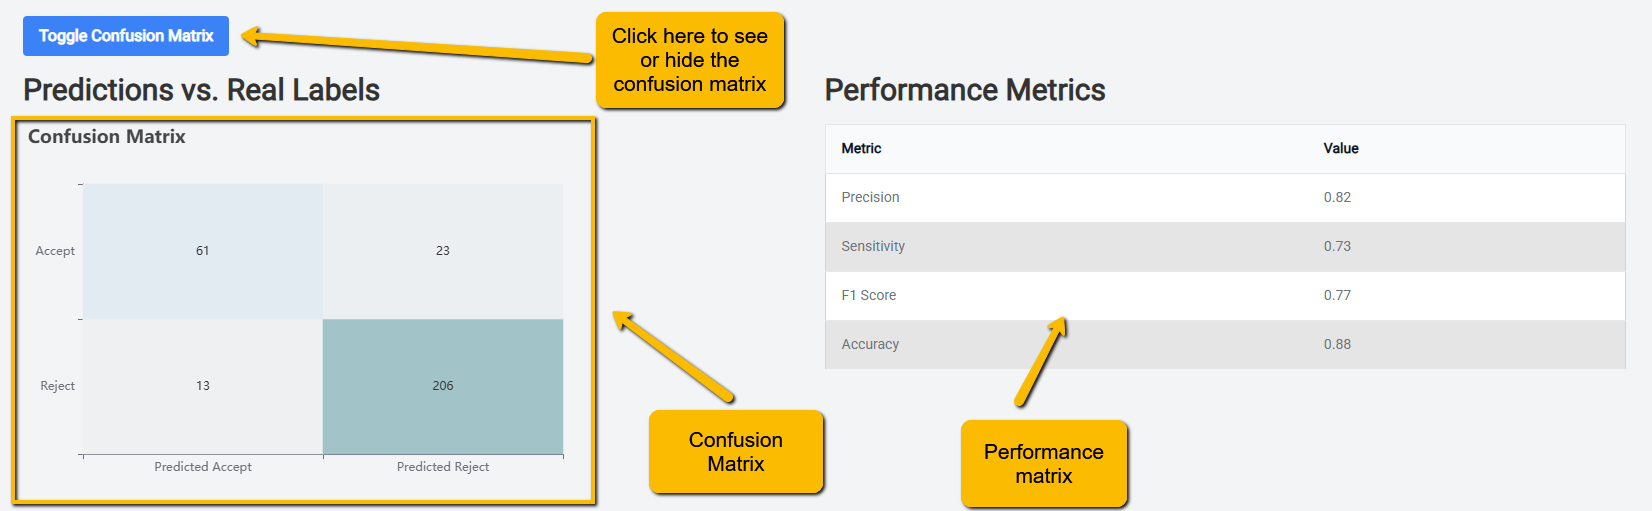
Predictions vs. real labels, with the derived performance metrics beside it.
The grid has columns = Predicted Accept / Predicted Reject and rows = Reject / Accept, giving
four cells:
| Predicted Accept | Predicted Reject | |
|---|---|---|
| Actually Accept | TP — true positive (correctly found a relevant study) | FN — false negative (missed a relevant study) |
| Actually Reject | FP — false positive (flagged an irrelevant study) | TN — true negative (correctly set aside) |
Each cell shows the count; darker shading = larger count.
The cell you care about most for a systematic review is FN (false negatives) — relevant studies
the model would have ranked low. A trustworthy model keeps FN very small.
¶ Performance Metrics
Shown beside the matrix, each rounded to two decimals:
| Metric | Formula | Reads as |
|---|---|---|
| Precision | TP / (TP + FP) | Of the citations the model called relevant, how many really were. |
| Sensitivity (Recall) | TP / (TP + FN) | Of the truly relevant citations, how many the model caught. The key metric for screening — you want this high so you don't miss studies. |
| F1 Score | harmonic mean of precision & recall | A single balance of the two. |
| Accuracy | (TP + TN) / total | Overall fraction correct. (Less informative here, because most citations are irrelevant.) |
¶ Rejection Streak Counter
The number of consecutive rejections since the last accepted citation, counting back from the
most recent decision. (As the in-app tooltip notes, "the ordering of citations is based on first
time labeled.")
How a citation counts as "rejected" depends on the screening type:
- Single screening — rejected if any reviewer rejected it.
- Double / all-reviewer screening — rejected only if all of its (non-blank) labels are reject.
- A quick Accept/Reject qualification overrides the individual labels.
Why it matters. Because you're screening in model-priority order (most promising first), a long rejection streak means you've gone a long stretch without finding anything relevant — a practical signal that you're near the bottom of the barrel and may be able to stop screening. Teams often pair a target streak length with the Estimated Coverage curve to justify a stopping decision.
¶ Putting it Together: Am I Done Screening?
No single number decides it, but these line up when you're finished:
- Estimated Coverage has flattened near the top (you've likely found ~all relevant studies).
- The Score Distribution of what's left is almost entirely in the low bins, and the
threshold tool shows few citations above ~0.5. - The Rejection Streak is long.
- The confusion matrix shows high Sensitivity with few false negatives.